SSD Speed ≠ Performance:3 Metrics That Matter for Server SSD Selection
Why isn’t “maximum read/write speed” a true measure of server SSD performance?
When evaluating SSDs, it’s tempting to focus on maximum read/write throughput. But “max speed” is a theoretical peak under ideal lab conditions; in real enterprise environments, those figures have limited value. For servers and data centers, selection should emphasize stability and reliability over time—especially under high-concurrency access and continuous, mixed workloads where consistent performance and low latency determine service quality.

Max Speed ≠ Effective Performance
An SSD’s maximum throughput is typically measured under ideal conditions—empty drive, ample SLC cache, single workload, and sequential transfers. Real production is more complex, for example:
- Multiple VMs concurrently accessing shared storage
- Databases issuing continuous random I/O
- Small-block and large-block mixes
- 24×7 operation
These conditions increase I/O pressure and trigger write amplification (WAF), SLC-cache exhaustion, and frequent garbage collection (GC)—all of which depress steady-state performance versus the label.
The Metrics That Matter: Consistency and Latency

IOPS Consistency

Write Consistency

Latency Distribution
For server use, stable performance is more valuable than momentary peaks. If an SSD’s performance swings under load or latency spikes, the result can be instability, application stalls, or even service outages. Prioritize the following when evaluating server SSDs:
| Performance Metrics | Importance |
| IOPS Consistency |
Assess whether the drive sustains stable performance under multi-threaded, high-load conditions. VM and database workloads are largely random. High peak IOPS can be misleading; long-run consistency is the exam that matters. As a rule of thumb, target ≥85% IOPS consistency, ideally ≥90%, to keep systems steady. |
| Write Consistency |
Observe whether performance remains stable during prolonged, heavy writes (e.g., large backups, DB logs, VM snapshots, continuous data ingestion). Focus on the long-term write performance curve—from fresh-out-of-box through nearly full. A flatter curve with minimal dips and quick recovery indicates strong write consistency.
|
| Latency Distribution |
Latency stability is more telling than an average value. Occasional latency outliers can still block I/O, stall applications, or interrupt services. Track P99 / P99.9 / P99.99 to understand how the slowest 1%, 0.1%, and 0.01% of I/O behave. P99.99 often best reflects worst-case response under extreme load and is a key QoS reliability indicator. |
Conclusion
Do not judge server SSDs by a spec sheet’s “maximum speed” alone. To determine suitability, you must examine performance consistency and tail latency. Include IOPS Consistency, Write Consistency, and Latency Distribution—validated with long-duration tests and your actual workload profile—when making your choice.
SSSTC offers a broad portfolio of enterprise and industrial SSD solutions featuring high-QoS firmware and rigorous performance validation, helping organizations build storage that is stable in performance and reliable over the long term.

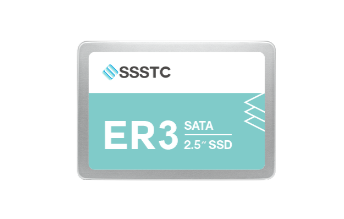
ER3 2.5"
NAND Flash: 3D TLC NAND Flash
Interface: SATA 3 (6Gb/s)
Sequential Read: UP to 520 MB/s
Sequential Write: UP to 520 MB/s
-
SSSTC SATA SSD
Widely used in rugged computers, laptops, servers, edge servers, video surveillance systems, and enterprise-level storage solutions, they offer stable and dependable data storage. -
SSSTC NVMe™ SSD
With high-speed transfer and low latency, it's used in data centers, cloud services, big data, gaming, and graphics, enhancing system performance and speed.


__24C05D67dI.webp)
__24C15hqqtC.png)
__24C15wOdCC.png)


__24C05XQ2my.jpg)


__24C05fplcZ.png)
__24C05vgHYC.png)


